By Lydia Denning, WMEAC Wolverine Community Advisory Group (CAG) Intern
The North Kent Study Area Map is a user-friendly tool developed to manage and consolidate a large range of PFAS data from EGLE (Michigan Department of Environment, Great Lakes, and Energy), and Wolverine Worldwide. Rick Rediske, Wolverine Community Advisory Group (WCAG) member and Water Resource Management Scientist gave insight on how this resource has significantly simplified the information-gathering process for both professionals and community members interested in understanding PFAS data.
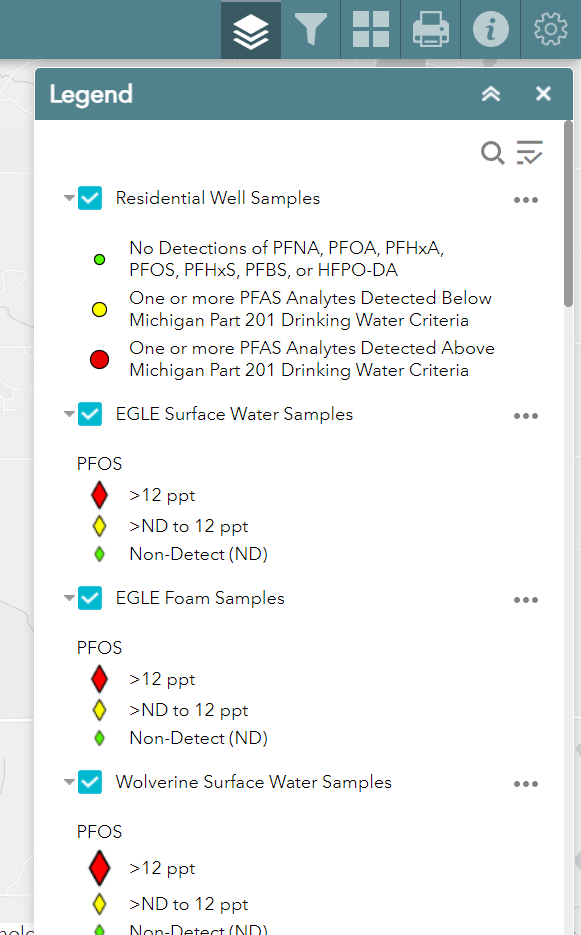
At its core, the North Kent Study Area Map is a Geographic Information Systems (GIS) map composed of multiple layers, each representing a different data set. These layers include Residential Well Samples, EGLE Surface Water Samples, Wolverine Groundwater Samples, and other critical water quality data points. Users can select specific data points to view essential information such as well depth, specific PFAS concentrations, and lab results. Choose the ‘stack of paper’ icon on the top right menu bar to view and adjust these layers.
Rediske emphasizes the importance of residents understanding the characteristics of their wells because “they are the water manager of that particular well. They should understand whether it’s deep or shallow, confined or unconfined.” These characteristics strongly affect the well’s water quality and susceptibility to PFAS contamination. The map’s detailed and localized information helps residents access this information which directly impacts the health and environmental impacts PFAS has on their water and neighborhoods.
Property owners can become a part of the data set if their water is sampled and included by EGLE. Residents who discover they are in or near a contamination zone should test their water for contaminants. Rediske also encourages users to look into the EGLE Michigan Action Response Team (MPART) Wellogic data set, which is a database of water well records and other drinking water quality data.
One of the most striking features of the North Kent Study Area Map is its visualization of high contamination levels, marked in red, which trace the spread of PFAS contamination towards the Rogue River. This PFAS “superhighway” migrates along a line of gravel created by 2 glaciers that once came together in this spot. Highlighting only 25 square miles of land, Rediske reflects that “it’s a sobering thing to look at and to see just how much contamination one industry has caused”. Even after remediation is complete, it could take an estimated 125 years to see changes in well contamination levels. Ensuring remediation is done sustainably with future impacts in mind is essential to improving well conditions and water quality.
It’s clear that the North Kent Study Area Map is an invaluable tool for understanding and addressing water contamination. By providing detailed, transparent information, it works to empower communities, researchers, and policymakers to make informed decisions and take proactive measures to protect public health and the environment.